USD/JPY: technical analysis
04 January 2018, 13:22
| Scenario | |
|---|---|
| Timeframe | Intraday |
| Recommendation | SELL |
| Entry Point | 112.59 |
| Take Profit | 112.00 |
| Stop Loss | 112.90 |
| Key Levels | 111.50, 111.75, 112.00, 112.30, 112.60, 112.88, 113.00, 113.30, 113.50 |
| Alternative scenario | |
|---|---|
| Recommendation | BUY STOP |
| Entry Point | 113.00 |
| Take Profit | 113.50 |
| Stop Loss | 112.70 |
| Key Levels | 111.50, 111.75, 112.00, 112.30, 112.60, 112.88, 113.00, 113.30, 113.50 |
USD/JPY, D1
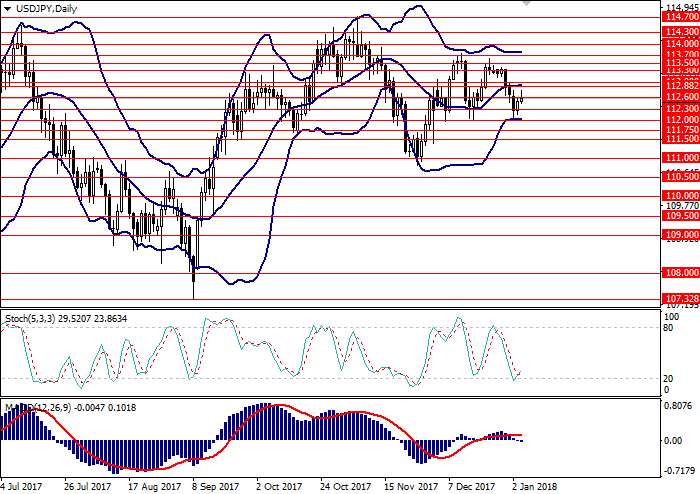
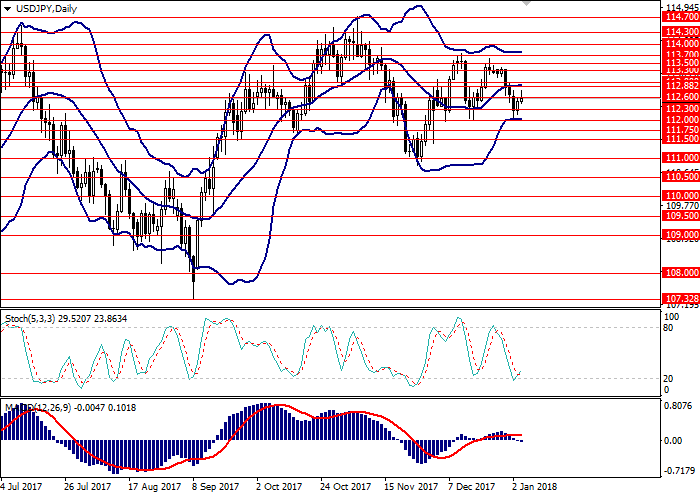
On the daily chart, the pair is moving within the sideways channel, formed by the middle line and the lower border of Bollinger Bands. MACD histogram is around the zero line, its volumes are minimal, the signal line is moving sideways. Stochastic is in the neutral zone at the border with the oversold area, keeping a weak buy signal.

USD/JPY, H4
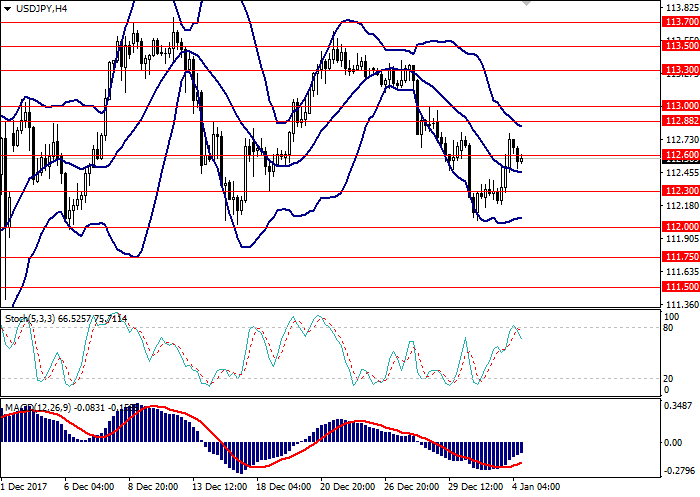
On the 4-hour chart, the instrument is moving downwards towards the middle line of Bollinger Bands. MACD histogram is in the negative zone, keeping a sell signal. Stochastic is ready to cross the border of the overbought area and give a sell signal.

Key levels
Resistance levels: 112.60, 112.88, 113.00, 113.30, 113.50.
Support levels: 112.30, 112.00, 111.75, 111.50.
Trading tips
Short positions can be opened at the current level with the target at 112.00 and stop loss 112.90.
Long positions can be opened at the level of 113.00 with the target at 113.50. Stop loss is 112.70.
Implementation period: 1–3 days.
On the daily chart, the pair is moving within the sideways channel, formed by the middle line and the lower border of Bollinger Bands. MACD histogram is around the zero line, its volumes are minimal, the signal line is moving sideways. Stochastic is in the neutral zone at the border with the oversold area, keeping a weak buy signal.

USD/JPY, H4
On the 4-hour chart, the instrument is moving downwards towards the middle line of Bollinger Bands. MACD histogram is in the negative zone, keeping a sell signal. Stochastic is ready to cross the border of the overbought area and give a sell signal.

Key levels
Resistance levels: 112.60, 112.88, 113.00, 113.30, 113.50.
Support levels: 112.30, 112.00, 111.75, 111.50.
Trading tips
Short positions can be opened at the current level with the target at 112.00 and stop loss 112.90.
Long positions can be opened at the level of 113.00 with the target at 113.50. Stop loss is 112.70.
Implementation period: 1–3 days.
Terima kasih telah membaca artikel ini & dipublikasikan oleh Info Malaysia


0 comments:
Post a Comment